SBIN [ 3-01-2014]
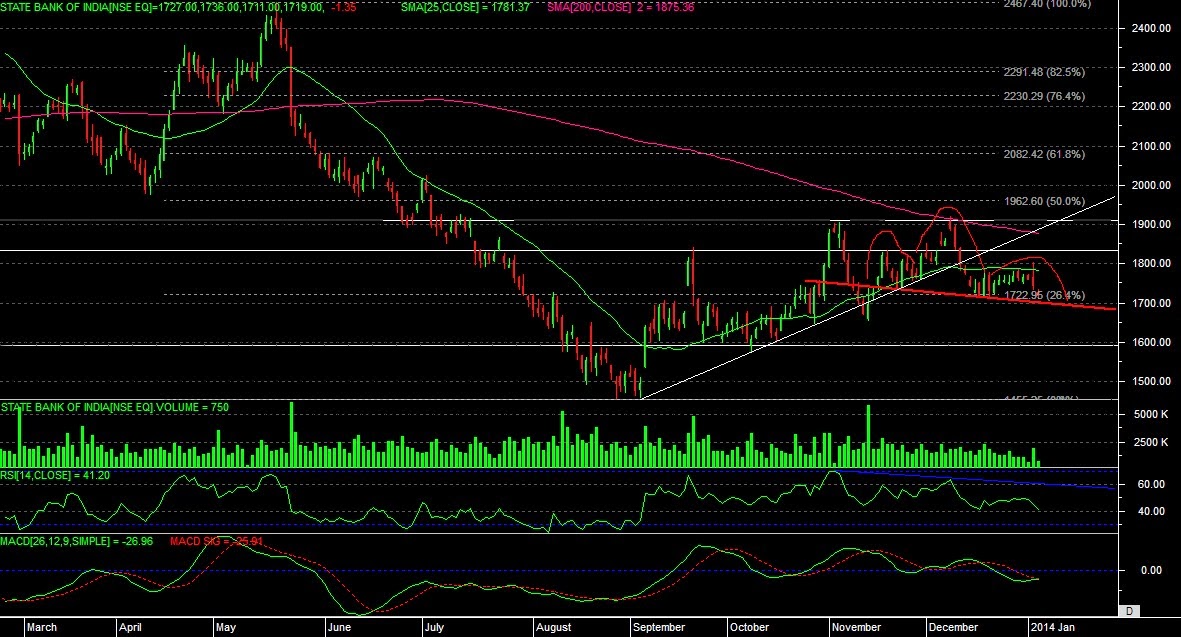
- Stock has made an Ascending Triangle Pattern on the daily charts , however stock has been trading in the compact range of the triangle for long toward the apex , which led the formation to see with suspicion and caution, and eventually the demand line of the triangle had broken on 11th December, 2013.
- Since then stock has taken resistance on 25 day S.M.A.
- Hence , now we can say Stock has been trading in the range of 300 points[ 1600-1900] from the past four months, which can be referred as rectangle and should be treated as such.
- Within the Triangle a Head and Shoulder pattern is visible, however the neckline is not as yet broken.
- Stock may touch the lower line of the Rectangle Pattern, or possibility of breakdown through it cannot be discarded, however on the flip side, if able to give closing above 25 day EMA in the near term, stock may test 200 S.M.A.
- Support 1675, 1650, 1600.

Gud analysis
ReplyDelete